Skip to content
Rejection analytics

Every rejected lead has a price tag.

See why leads don’t sell, what each reason costs you, and which one to fix first — with the exact rule that fired on every rejection, not just the fact that one did.
Ranked by missed revenue
The rule that fired
Action plan
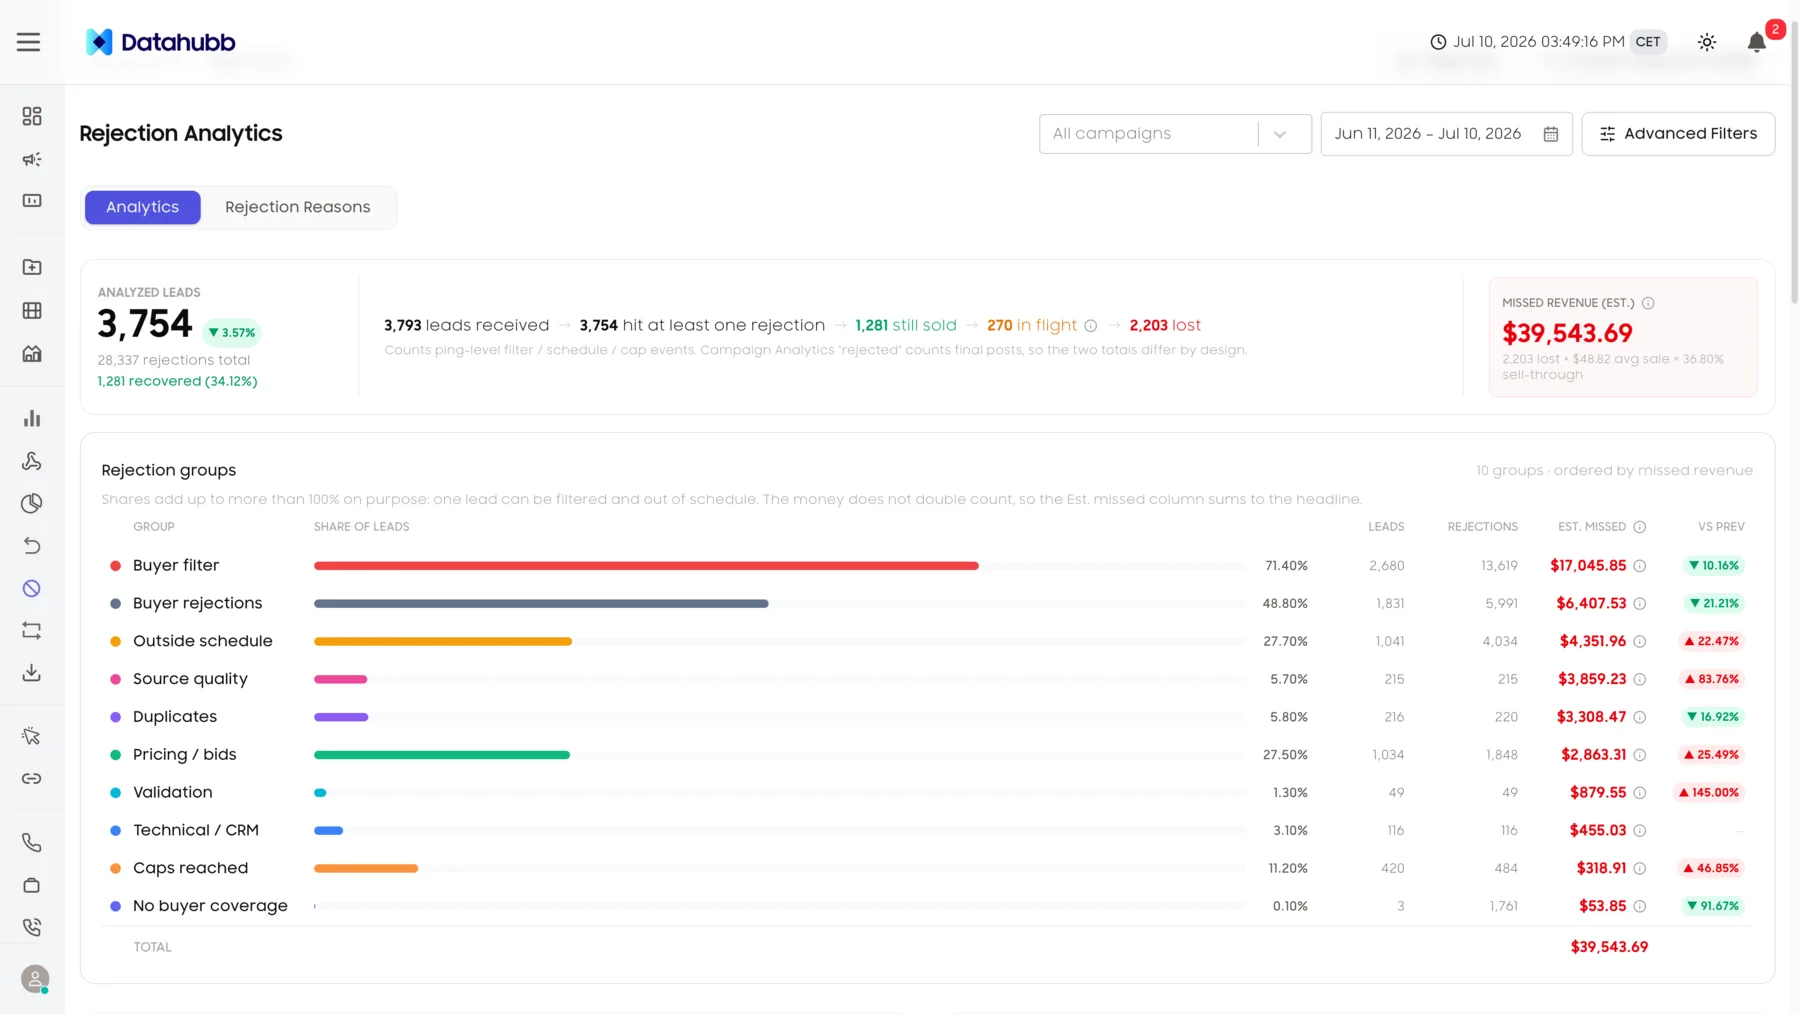
Rejection reasons dashboard showing why leads were rejected and the revenue lost to each reason
What you get

From “leads got rejected” to “fix this one first”

Rejections are not a log to scroll through. They are a ranked list of things costing you money, and each one names the change that closes it.

A number that does not double-count

A lead turned away by twelve buyers is still one lost lead. The loss is counted per lead, not per rejection, and each lost lead’s value is split across the groups that rejected it — so the parts sum to the headline exactly.

Ranked by money, not by volume

Eleven rejection groups, ordered by what they cost you. A small group can carry more revenue than a large one, and sorting by count is exactly what hides that.

The rule that actually fired

Not “rejected by the credit check”, but “rejected because unsecured credit had to be over 10,000 and this lead had 4,500”. The buyer filter, the missed window, the full cap, the bid against the floor — the specific condition, with the lead’s real value next to it.

When you are sending at the wrong time

Rejections by hour of day, switched into your buyer’s timezone. If you are posting leads outside their delivery window, the histogram names the hours — and that is a change you can make this afternoon.

An action plan from your own numbers

Recommendations ordered by impact, each carrying the evidence behind it and a way to act on it — open that buyer’s settings, focus on that affiliate, or export the proof for the conversation.

A workflow, not just a chart

Mark a reason in progress, resolved, or won’t-fix, with a note and a preview of exactly how many records you are about to touch. Closed reasons leave the list, so what remains is what still needs you.

The money model

An honest number beats a scary one

It would be easy to total up every rejection and show you an enormous figure. It would also be wrong — a lead twelve buyers turned away is still one lead. The headline counts lost leads and weights them by what leads like that actually sell for, so it is a number you can take into a meeting and defend.

  • Lost leads × what a sold lead fetched × how often rejected leads still sell
  • Every group’s share sums to the headline, never past it
  • The best case is shown separately — that is the ceiling, not the estimate
Rejection reasonslast 30d
Filter
412
Duplicate
268
Validation
174
Buyer
96
Cap reached
51
Duplicate + validation rejections flag recoverable supplier revenue for review.
How it gets used

A Monday morning, in four moves

The dashboard is built around one workflow: find the money, name the cause, prove it, and hand it to whoever can fix it.

Sort the rejection groups by estimated missed revenue and start at the top
Switch the angle to buyers, affiliates, campaigns, or traffic sources — then export the evidence
Filter to leads whose enriched fields failed a threshold, like unsecured credit under 10,000
Open a single rejection and read the buyer’s own verdict, with the full lead payload beside it
FAQ

Frequently asked questions

Lost leads, multiplied by what a sold lead actually fetched in that window, multiplied by the share of rejected leads that still went on to sell. It is an expected value — the revenue you would most likely have made — not a claim that every lost lead was sellable. The best case, "if every lost lead had sold", is shown separately, so you can see the ceiling as well as the estimate.

Deliberately not. It would be easy to add up the value of every rejection event and quote a far bigger figure — and it would be wrong, because a lead fanned out to twelve buyers can only be lost once. The headline counts lost leads, and each group’s share is a weighted slice of that same total. The parts add up to the whole, not to something larger.

Because one lead can fail in more than one way — filtered by one buyer and outside another buyer’s schedule at the same time. The group shares overlap on purpose. The money does not: the estimated-missed column still sums to the headline. There is also a per-lead view that gives each lead a single primary reason, and those slices do total 100%.

Both, and the distinction matters. A lead rejected by one buyer and bought by the next is a recovered lead — it counts toward your recovery rate, not your loss. Only leads that were rejected, never sold, and are not still in flight are counted as lost.

They answer different questions. This view counts every filter, schedule, and cap event at the ping level; campaign analytics counts final posts. They are not meant to reconcile, and no toggle makes them agree — a gap between them is expected, not a bug.

It is the first thing to fix. When a buyer’s responses are not mapped into structured reasons, their rejections land as raw messages that cannot be grouped or acted on — and the dashboard will tell you so rather than quietly averaging them in. Fixing that buyer’s response mapping comes before trusting any other number on the page.

Find out what your rejections are costing you.

Start your 14-day trial. Full platform access. Card required, no charge if you cancel during the trial.