Volume is easy to see. Margin is the hard part.
Datahubb holds revenue, cost and profit on every lead, buyer, campaign and source — and updates them as leads settle rather than at the end of the month. Here is exactly how that number is put together.
A number you can take apart
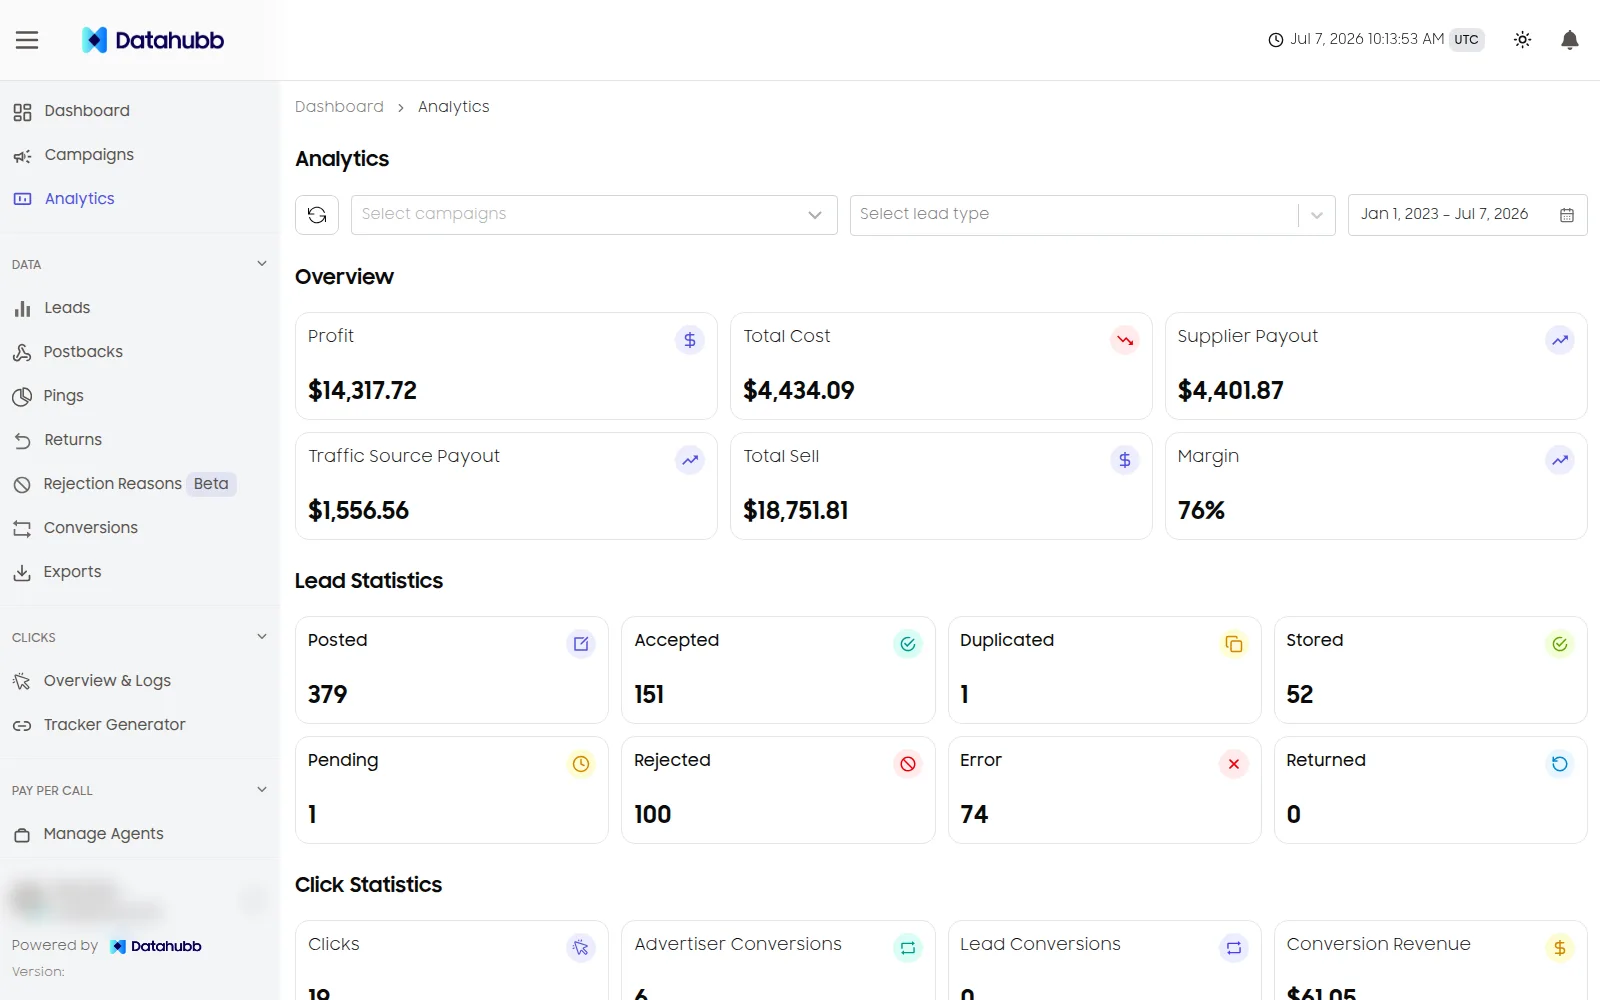
Margin is a subtraction, and the whole value of it is being able to see both sides. Revenue is what the buyer actually paid for a sold lead — the bid that won, or the payout rule that overrode it. Cost is what you owe the supplier or traffic source for that same lead. The difference is carried on the lead itself, then rolled up wherever you look at it.
- Every settled lead increments a counter on the current hour’s bucket for its buyer, supplier and campaign — leads, accepted, rejected, revenue, payout
- Nothing waits for a nightly batch: the same write that books the sale moves the margin
- CPA leads awaiting confirmation add nothing until the postback lands, and a returned lead reverses the revenue it booked
- Storing the hour, not the lead, is why a year-to-date range still loads
Each settled lead increments the current hour’s counters — buyer, supplier, campaign.
Profit visibility, not just volume
Lead counts tell you the machine is running. Margin tells you whether it is worth running. Every view here resolves back to the second question.
Both sides of the subtraction
Revenue is what the buyer paid. Cost is what you owe the supplier or traffic source for that same lead. Margin is held per lead and rolled up per buyer, campaign, supplier and source — so profit is a column, not a spreadsheet you build later.
Four buckets, never blurred
Sold, pending, rejected, returned. A CPA lead pending confirmation is not revenue, and a clawback is not the same thing as a CPA decline. Keeping them apart is the difference between a return rate you can act on and one that is quietly wrong.
EPC that says which EPC
Blended EPC answers “what did the traffic I bought earn?”. Offer-side EPC answers “what did this surface earn?”. They are different numbers and the dashboard labels which one you are looking at instead of averaging them into a third.
Rejections, with a cause
Every rejected lead grouped by what stopped it — a filter, a duplicate, a validation rule, the buyer’s own verdict, or a cap that was already full — with the buyer’s raw response one click away in the ping and post log.
Long ranges stay fast
Stats are pre-aggregated into hourly buckets per entity, so a year-to-date view reads a few thousand rows instead of scanning every lead you have ever taken.
Slice it, then keep the slice
Filter by campaign — several at once — buyer, supplier, traffic source, date range and timezone. Export the exact view, and save the column set as a preset so next week’s report is one click.
Sold, pending, rejected, returned
Most reporting mistakes in lead distribution are one of these four being quietly counted as another. A CPA lead that has not been confirmed is not revenue. A CPA lead the buyer declined never was. A sold lead clawed back is a real reversal and belongs in a different column entirely. Datahubb keeps them apart at the source, so the acceptance rate and the return rate mean what they say.
- Sold — realised revenue, the only bucket that feeds the margin line
- Pending — a CPA lead awaiting the buyer’s confirmation postback
- Rejected — declined, never realised
- Returned — sold, then clawed back, and the revenue reversed
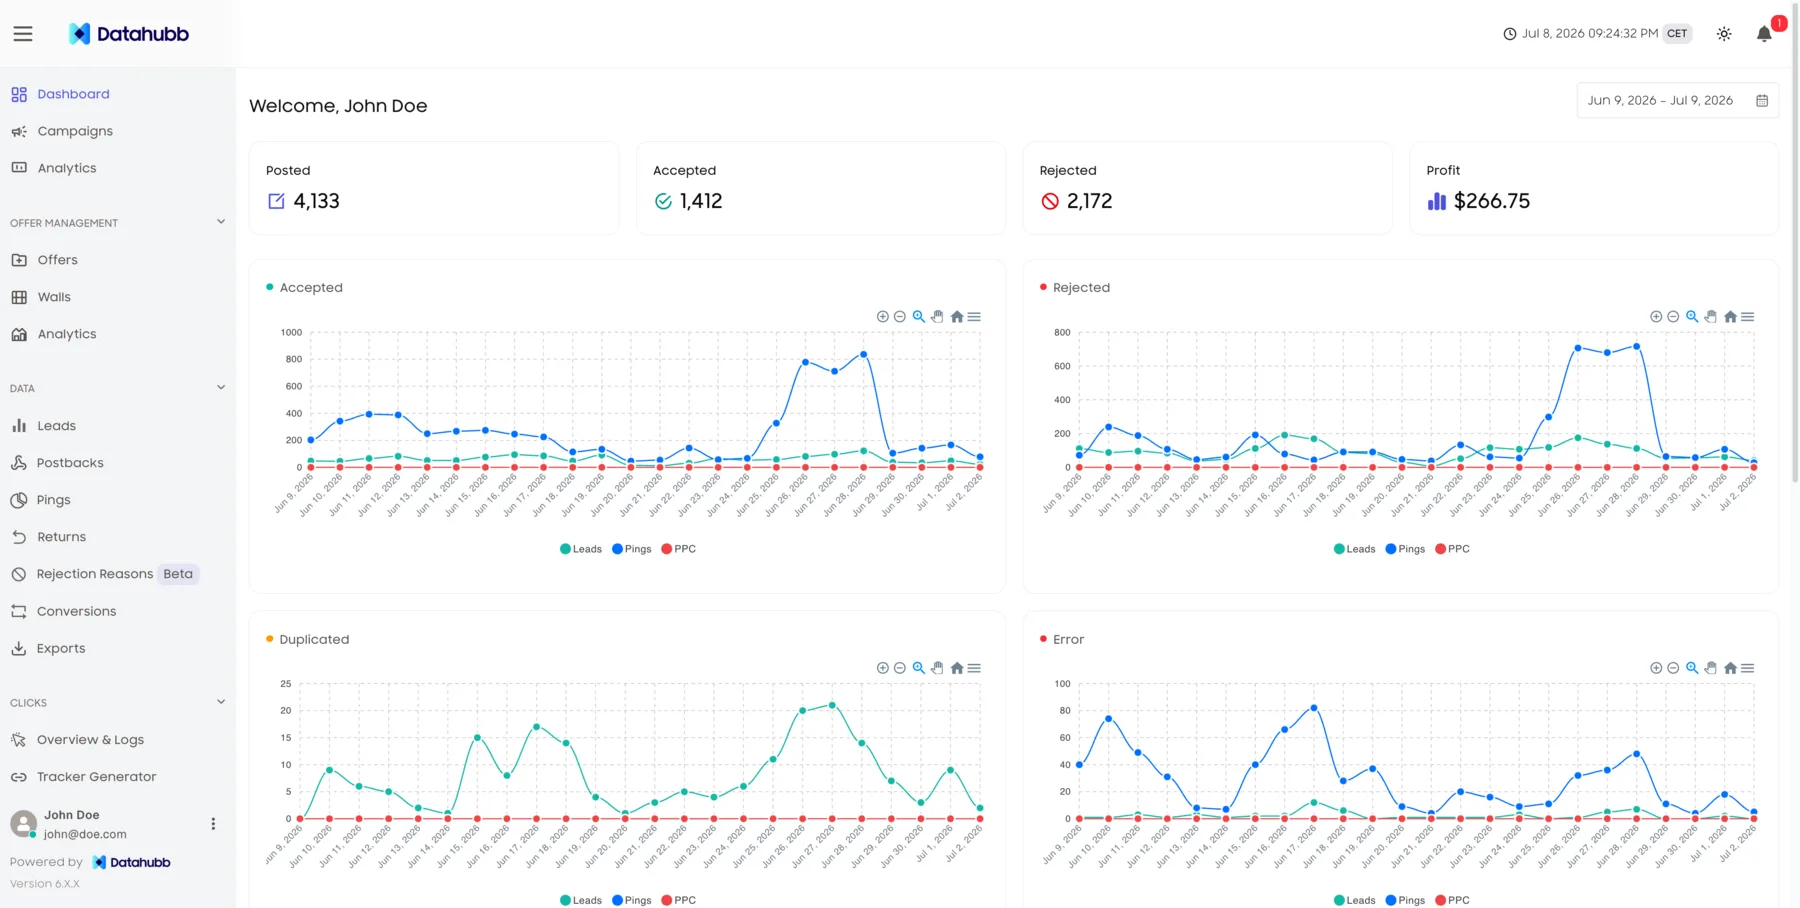
From a KPI card to the buyer’s own words
The reporting surfaces are laid out as one path: notice it on the dashboard, narrow it in analytics, then prove it in the raw delivery log.
Frequently asked questions
Know your margin while the traffic is still running.
Start your 14-day trial. Full platform access. Card required, no charge if you cancel during the trial.